-
- Integrating Grafana and Prometheus for Real-Time VPS Monitoring
- Why Use Grafana and Prometheus?
- Configuration Steps
- Step 1: Install Prometheus
- Step 2: Configure Prometheus
- Step 3: Install Grafana
- Step 4: Configure Grafana to Use Prometheus as a Data Source
- Step 5: Create Dashboards in Grafana
- Practical Examples
- Best Practices
- Case Studies and Statistics
- Conclusion
Integrating Grafana and Prometheus for Real-Time VPS Monitoring
In today’s fast-paced digital landscape, monitoring the performance of Virtual Private Servers (VPS) is crucial for maintaining uptime, optimizing resource usage, and ensuring a seamless user experience. Grafana and Prometheus are two powerful open-source tools that, when integrated, provide a robust solution for real-time monitoring and visualization of server metrics. This guide will walk you through the steps to integrate Grafana and Prometheus, offering practical examples, best practices, and actionable insights to enhance your VPS monitoring capabilities.
Why Use Grafana and Prometheus?
Grafana is a leading open-source analytics and monitoring platform that allows users to visualize data from various sources, while Prometheus is a powerful time-series database designed for monitoring and alerting. Together, they provide:
- Real-time data collection and visualization
- Customizable dashboards for different metrics
- Alerting capabilities to notify users of performance issues
- Scalability to handle large volumes of data
Configuration Steps
Step 1: Install Prometheus
To begin, you need to install Prometheus on your VPS. Follow these steps:
-
- Download the latest version of Prometheus from the official website:
wget https://github.com/Prometheus/Prometheus/releases/latest/download/Prometheus-.linux-amd64.tar.gz
-
- Extract the downloaded file:
tar xvfz Prometheus-.linux-amd64.tar.gz
-
- Navigate to the extracted directory:
cd Prometheus-.linux-amd64
-
- Start Prometheus with the default configuration:
./Prometheus --config.file=Prometheus.yml
Step 2: Configure Prometheus
Next, you need to configure Prometheus to scrape metrics from your VPS. Edit the Prometheus.yml file to include your target servers:
global:
  scrape_interval: 15s

scrape_configs:
  - job_name: 'vps'
    static_configs:
      - targets: ['localhost:9100']
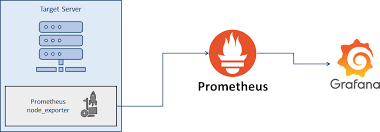
In this example, we are scraping metrics from a node exporter running on the same VPS. Adjust the targets as necessary for your environment.
Step 3: Install Grafana
Now, install Grafana on your VPS:
-
- Add the Grafana APT repository:
sudo apt-get install -y software-properties-common
sudo add-apt-repository "deb https://packages.Grafana.com/oss/release/deb stable main"
-
- Install Grafana:
sudo apt-get update
sudo apt-get install Grafana
-
- Start the Grafana service:
sudo systemctl start Grafana-server
-
- Enable Grafana to start on boot:
sudo systemctl enable Grafana-server
Step 4: Configure Grafana to Use Prometheus as a Data Source
Once Grafana is installed, you need to configure it to use Prometheus as a data source:
- Open your web browser and navigate to
http://:3000. - Log in with the default credentials (admin/admin).
- Go to Configuration > Data Sources.
- Click on Add data source and select Prometheus.
- Set the URL to
http://localhost:9090(or your Prometheus server URL). - Click Save & Test to verify the connection.
Step 5: Create Dashboards in Grafana
With Prometheus configured as a data source, you can now create dashboards to visualize your metrics:
-
- Go to <strong+Dashboards > New Dashboard.
- Add a new panel and select the Prometheus data source.
- Enter a Prometheus query to visualize specific metrics, such as:
node_cpu_seconds_total
- Customize the visualization type (e.g., graph, gauge) and save the dashboard.
Practical Examples
Here are a few practical examples of metrics you can monitor using Grafana and Prometheus:
- CPU Usage: Monitor CPU load and usage patterns over time.
- Memory Usage: Track memory consumption and identify potential memory leaks.
- Disk I/O: Analyze disk read/write operations to optimize performance.
- Network Traffic: Monitor incoming and outgoing traffic to detect anomalies.
Best Practices
To ensure optimal performance and reliability in your monitoring setup, consider the following best practices:
- Regularly update Grafana and Prometheus to the latest versions for security and feature enhancements.
- Use labels in Prometheus to categorize metrics for easier querying and visualization.
- Implement alerting rules in Prometheus to proactively notify you of performance issues.
- Optimize your queries in Grafana to reduce load on the Prometheus server.
Case Studies and Statistics
According to a recent survey by the Cloud Native Computing Foundation, over 70% of organizations using Kubernetes rely on Prometheus for monitoring. Additionally, companies that implemented Grafana reported a 30% increase in operational efficiency due to improved visibility into their systems.
Conclusion
Integrating Grafana and Prometheus for real-time VPS monitoring is a powerful way to enhance your server management capabilities. By following the steps outlined in this guide, you can set up a robust monitoring solution that provides valuable insights into your server’s performance. Remember to adhere to best practices and continuously refine your monitoring setup to adapt to changing needs. With Grafana and Prometheus, you can ensure your VPS operates at peak performance,